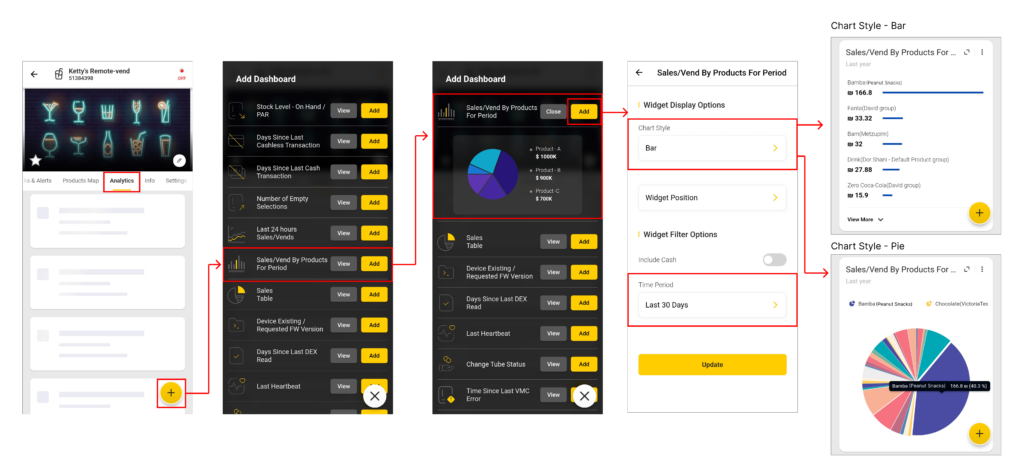
Do you want to know which products are the best sellers and which are the least ones? With our new dashboard – you can see it in an easy way! This dashboard can be found in machine analytics and dashboards, so you can see your products’ sales division both for the machine and for the actor level.
Adding this dashboard is as easy as clicking the plus FAB button >> choosing “Sales/Vends by Product for period” >> choosing a bar chart or pie chart >> and selecting your desired time period: Today, Yesterday, Last 10 days, Last 30 days, This/Last Week, This/Last Month, and This/Last Year.
